Have you ever wished there was a way to get inside your customer’s head? Find out what products and services appeal to them most? Or where they are clicking, scrolling or exploring and why? Say hello to live session recordings and heatmaps!
Live Session Recordings and Heatmaps can be your saving grace! These SEO (search engine optimization) tools can help you to better understand what visitors do on your website by providing down-to-the-click information of how and where they are navigating. These tools can even give you precise real-time data. Let’s explore the basics of how they work.
Live Session Recording
Live session recordings are just that. They allow you to see the actual movements of your website visitors in their real-time movements, to better help you understand their viewing and site consumption habits. You can see things like:
- Mouse movements
- Clicks on your website
- How far down they scrolled on your page
- What elements/features were explored/clicked on

Not only does it give you helpful information of what customers are looking at, it can also give you some insight into what is NOT working on your page. Which features aren’t getting clicks, being navigated to or explored? It’s a great indicator of content success. Tracing visitor’s clicks can tell you how much of your content was consumed, how far down the page they scrolled and how much time they spent on your website in general.
Heatmaps
Like its counterpart, heatmaps are also a very helpful tool in gathering insight into visitor’s behaviors as they navigate your website. A heatmap provides you with more information to analyze and understand how customers to your site are consuming your site. This, in turn, allows you to customize your website to better suit your end user’s experience.
There are 4 main types of heatmaps (each providing a different way to analyze data):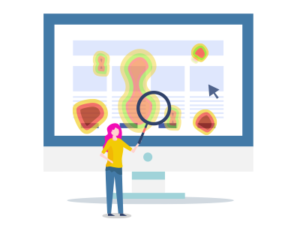
- Click Maps
- Precise Interactive Maps
- Move Maps
- Scroll Maps
Click Maps
As from the name, you can probably decipher that a click map tracks all the places that a visitor clicked their cursor (or if on a mobile device, tapped). Click maps can help you tell what pages/products/areas of your website are the most popular and see the most traffic. Click maps utilize colored dots to show you the areas your potential customers are exploring.
Precise Interactions Map
Precise Interactions maps, or confetti maps, are much like a click map, but are represented as individual colored dots on your page. They can easily show you the most-clicked on elements of your page by pinpointing exactly where your potential customers are clicking. It’s also a very useful tool in indicating pain–points on your page, if users are trying to click on non-clickable elements, and how to make adjustments for a better user experience. They use a warm/cool color scheme to indicate how the elements on their pages/website are performing. The warmer the dot, the higher that element performs; the cooler, the less effective it is. Using click maps, you can track clicks on things like: Images, links, CTAs (calls-to-action items), etc.
Move Maps
Move maps or ‘hover maps’ show a broader brushstroke by highlighting where the person moved or hovered their cursor on the screen. Without the ability to track ‘hovering’ movements on tablet or mobile devices, this heatmap is only available on desktop computers. Move maps show you what areas of your page your customers are looking at and for how long which can also indicate which areas they find most interesting or are taking the longest to consume.
Scroll Maps
Scroll maps, also aptly named, track an even more general movement of how far down your page the visitor scrolled and which sections they spent the most time exploring. They can help you gauge things like if your CTAs (call-to-action) items are working and if guests are scrolling past the “fold” of your page.
Thanks to live session recordings and heatmaps you CAN get into your prospective customers’ heads. By analyzing their clicks, keystrokes and movement habits, you can see where your website is succeeding and where it’s failing. They can help you better understand WHY your visitors are doing what they’re doing on your website and make the necessary adjustments to include better user experiences and keep them scrolling for longer.
Cape & Plymouth Marketing uses the insight from these tools to better help our clients understand and visualize where their customers are interacting, or not interacting, with their website. These wonderful insights also help us to assist our clients with end-user experience in mind, leading to a more streamlined, higher lead generating outcome in the process. We help businesses convert more leads from the traffic they already have on their website and we can help your business too! See the results for yourself, find out more by contacting Cape & Plymouth Marketing by visiting https://capeplymouthseo.com/contact/ or calling (508) 375-3618 today!